Optimization Phases and Missed Opportunities

There are two complementary skills that are very useful in query tuning. One is the ability to read and interpret execution plans. The second is knowing a bit about how the query optimizer works to translate SQL text into an execution plan. Putting the two things together can help us spot times when an expected optimization was not applied, resulting in an execution plan that is not as efficient as it could be. The lack of documentation around exactly which optimizations SQL Server can apply (and in what circumstances) means that a lot of this comes down to experience, however.
An Example
The sample query for this article is based on question asked by SQL Server MVP Fabiano Amorim a few months ago, based on a real-world problem he encountered. The schema and test query below is a simplification of the real situation, but it retains all the important features:
CREATE TABLE dbo.T1
(
    pk integer PRIMARY KEY CLUSTERED,
    c1 integer NOT NULL
);
GO
CREATE TABLE dbo.T2
(
    pk integer PRIMARY KEY CLUSTERED,
    c1 integer NOT NULL
);
GO
CREATE TABLE dbo.T3
(
    pk integer PRIMARY KEY CLUSTERED,
    c1 integer NOT NULL
);
GO
CREATE INDEX nc1 ON dbo.T1 (c1);
CREATE INDEX nc1 ON dbo.T2 (c1);
CREATE INDEX nc1 ON dbo.T3 (c1);
GO
CREATE VIEW dbo.V1
AS
    SELECT c1 FROM dbo.T1
    UNION ALL
    SELECT c1 FROM dbo.T2
    UNION ALL
    SELECT c1 FROM dbo.T3;
GO
-- The test query
SELECT MAX(V1.c1)
FROM dbo.V1 AS V1;
Test 1: 10,000 rows, SQL Server 2005 or later
The specific table data does not really matter for these tests. The following queries load 10,000 rows from a numbers table to each of the three test tables:
INSERT dbo.T1
    (pk, c1)
SELECT
    N.n, N.n
FROM dbo.Numbers AS N
WHERE
    N.n BETWEEN 1 AND 10000;

INSERT dbo.T2
    (pk, c1)
SELECT
    T1.pk, T1.c1
FROM dbo.T1 AS T1;

INSERT dbo.T3
    (pk, c1)
SELECT
    T1.pk, T1.c1
FROM dbo.T1 AS T1;
With the data loaded, the execution plan produced for the test query is:
SELECT MAX(V1.c1)
FROM dbo.V1 AS V1;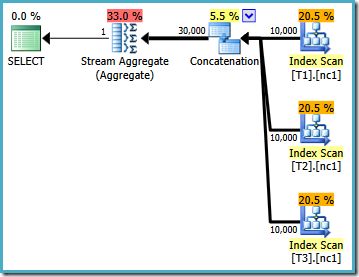
This execution plan is a pretty direct implementation of the logical SQL query after the view reference V1 is expanded. The optimizer sees the query after view expansion, almost as if the query had been written out in full:
SELECT MAX(V1.c1)
FROM
(
    SELECT c1 FROM dbo.T1
    UNION ALL
    SELECT c1 FROM dbo.T2
    UNION ALL
    SELECT c1 FROM dbo.T3
) AS V1;
Comparing the expanded text to the execution plan, the directness of the query optimizer’s implementation is clear. There is an Index Scan for each read of the base tables, a Concatenation operator to implement the UNION ALL, and a Stream Aggregate for the final MAX aggregate.
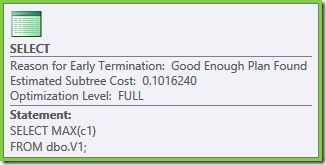
The execution plan properties show that cost-based optimization was started (optimization level is FULL), but that it terminated early because a ‘good enough’ plan was found. The estimated cost of the selected plan is 0.1016240 magic optimizer units.
Test 2: 50,000 rows, SQL Server 2008 and 2008 R2
Run the following script to set the test environment to run with 50,000 rows:
TRUNCATE TABLE dbo.T1;
TRUNCATE TABLE dbo.T2;
TRUNCATE TABLE dbo.T3;

INSERT dbo.T1
    (pk, c1)
SELECT
    N.n, N.n
FROM dbo.Numbers AS N
WHERE
    N.n BETWEEN 1 AND 50000;

INSERT dbo.T2
    (pk, c1)
SELECT
    T1.pk, T1.c1
FROM dbo.T1 AS T1;

INSERT dbo.T3
    (pk, c1)
SELECT
    T1.pk, T1.c1
FROM dbo.T1 AS T1;

SELECT MAX(V1.c1)
FROM dbo.V1 AS V1;
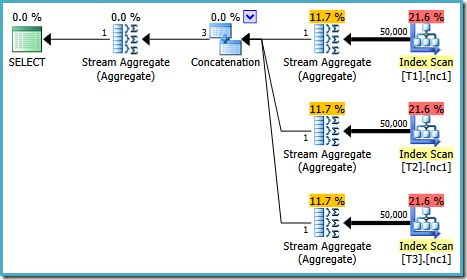
The execution plan for this test depends on the version of SQL Server you are running. On SQL Server 2008 and 2008 R2, we get the following plan:
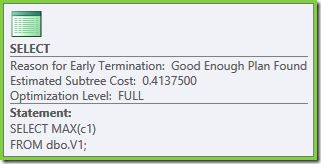
The plan properties show that cost-based optimization still ended early for the same reason as before. The estimated cost is higher than previously at 0.41375 units, but that is expected due to the higher cardinality of the base tables.
Test 3: 50,000 rows, SQL Server 2005 and 2012 onward
The same query run on SQL Server 2005 or 2012 onward produces a different execution plan:
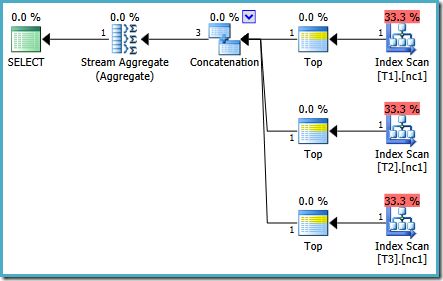
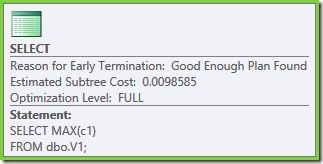
Optimization ended early again, but the estimated plan cost for 50,000 rows per base table is down to 0.0098585 (from 0.41375 on SQL Server 2008 and 2008 R2).
Explanation
The SQL Server query optimizer separates its effort into multiple stages. Later stages add more optimization techniques and allow more ‘time’. The optimization stages are:
- Trivial plan
- Cost-based optimization
- Transaction Processing (search 0)
- Quick Plan (search 1)
- Quick Plan (search 1) with parallelism enabled
- Full Optimization (search 2)
None of the tests performed here qualify for a trivial plan because the aggregate and unions have multiple implementation possibilities, requiring a cost-based decision.
Transaction Processing
The Transaction Processing (TP) stage requires that a query contains at least three table references, otherwise cost-based optimization skips this stage and moves straight on to Quick Plan.
The TP stage is aimed at the low-cost navigational queries typical of OLTP workloads. It tries a limited number of optimization techniques, and is limited to finding plans with Nested Loop Joins (unless a Hash Join is needed to generate a valid plan).
In some respects it is surprising that the test query qualifies for a stage aimed at finding OLTP plans. Although the query contains the required three table references, it does not contain any joins. The three table requirement is just a heuristic, so I won’t labour the point.
Which Optimizer Stages Were Run?
There are a number of methods, the documented one being to compare the contents of sys.dm_exec_query_optimizer_info before and after compilation. This is fine, but it records instance-wide information so you need to be careful that yours is the only query compilation that happens between snapshots.
An undocumented (but reasonably well-known) alternative that works on all currently supported versions of SQL Server is to enable trace flags 8675 and 3604 while compiling the query.
Test 1
This test produces trace flag 8675 output similar to the following:

The estimated cost of 0.101624 after the TP stage is low enough that the optimizer does not go on to look for cheaper plans. The plan we end up with is quite reasonable, given the relatively low cardinality of the base tables, even if it is not truly optimal.
Test 2
With 50,000 rows in each base table, the trace flag reveals different information:
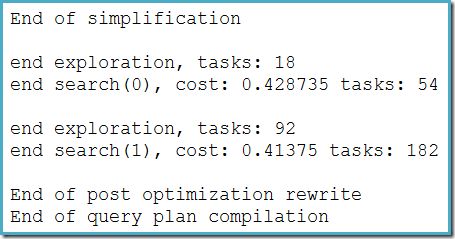
This time, the estimated cost after the TP stage is 0.428735 (more rows = higher cost). This is enough to encourage the optimizer into the Quick Plan stage.
With more optimization techniques available, this stage finds a plan with a cost of 0.41375. This does not represent a huge improvement over the test 1 plan, but it is lower than the default cost threshold for parallelism, and not enough to enter Full Optimization, so again optimization ends early.
Test 3
For SQL Server 2005 and 2012 onward, the trace flag output is:
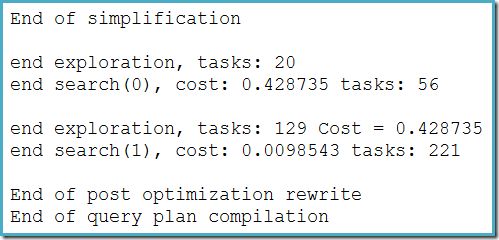
There are minor differences in the number of tasks run between versions, but the important difference is that on SQL Server 2005 and 2012, the Quick Plan stage finds a plan costing only 0.0098543 units.
This is the plan that contains Top operators instead of the three Stream Aggregates below the Concatenation operator seen in the SQL Server 2008 and 2008 R2 plans.
Bugs and Undocumented Fixes
SQL Server 2008 and 2008 R2 contain a regression bug (compared with 2005) that was fixed under trace flag 4199, but not documented as far as I can tell.
There is documentation for TF 4199 that lists fixes made available under separate trace flags before becoming covered by 4199, but as that Knowledge Base article says:
This one trace flag can be used to enable all the fixes that were previously made for the query processor under many trace flags. In addition, all future query processor fixes will be controlled by using this trace flag.
The bug in this case is one of those ‘future query processor fixes’. A particular optimization rule, ScalarGbAggToTop, is not applied to the new aggregates seen in the test 2 plan.
With trace flag 4199 enabled on suitable builds of SQL Server 2008 and 2008 R2, the bug is fixed and the optimal plan from test 3 is obtained:
-- Trace flag 4199 required for 2008 and 2008 R2
SELECT MAX(V1.c1)
FROM dbo.V1 AS V1
OPTION (QUERYTRACEON 4199);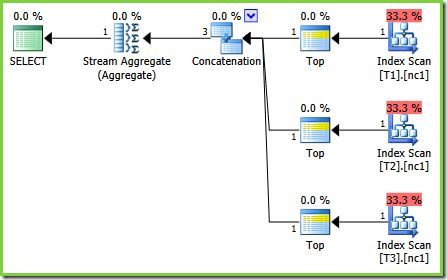
Conclusion
Once you know that the optimizer can transform a scalar MIN or MAX aggregate to a TOP (1) on an ordered input, the plan shown in test 2 seems strange. The scalar aggregates above an index scan (which can provide order if asked to do so) stand out as a missed optimization that would normally be applied.
This is the point I was making in the introduction: Once you get a feel for the sorts of things the optimizer can do, it can help you recognize cases where something has gone wrong.
The answer will not always be to enable trace flag 4199, since you might come across issues that have not yet been fixed. You also might not want the other QO fixes covered by the trace flag to apply in a particular case. Optimizer fixes do not always make things better. If they did, there would be no need to protect against plan regressions using this flag.
The solution in other cases might be to formulate the SQL query using different syntax, to break the query up into more optimizer-friendly chunks, or something else. Whatever the answer turns out to be, it still pays to know a bit about optimizer internals so you can recognize that there was a problem in the first place.
Thanks for reading.
