Query Optimizer Deep Dive—Part 3

This is the third in a series of posts based on the content of the Query Optimizer Deep Dive presentations I have given over the last month or so at the Auckland SQL Users’ Group, and SQL Saturday events in Wellington, New Zealand and Adelaide, Australia.
Storage of Alternative Plans
We saw in part 2 how optimizer rules are used to explore logical alternatives for parts of the query tree, and how implementation rules are used to find physical operations to perform each logical steps.
To keep track of all these options, the cost-based part of the SQL Server query optimizer uses a structure called the Memo. This structure is part of the Cascades general optimization framework developed by Goetz Graefe.
The Memo provides an efficient way to store many plan alternatives via the use of groups. Each group in the Memo initially contains just one entry — a node from the input logical tree.
As exploration and implementation phases progress, new groups may be added, and new physical and logical alternatives may be added to existing groups (all alternatives in a group share the same logical properties, but will often have quite different physical properties). Groups are shared between plan alternatives where possible, allowing Cascades to search more plans in the same time and space compared with other optimization frameworks.
Continuing with our AdventureWorks example query, the input tree to cost-based optimization is first copied into the Memo structure. We can see this structure using trace flag 8608:
-- Initial memo contents
SELECT
    P.[Name],
    Total = SUM(INV.Quantity)
FROM
    Production.Product AS P,
    Production.ProductInventory AS INV
WHERE
    INV.ProductID = P.ProductID
    AND P.[Name] LIKE N'[A-G]%'
GROUP BY
    P.[Name]
OPTION
(
    QUERYTRACEON 8608
);
As a reminder, this is the logical tree passed to cost-based optimization as shown in part 2:
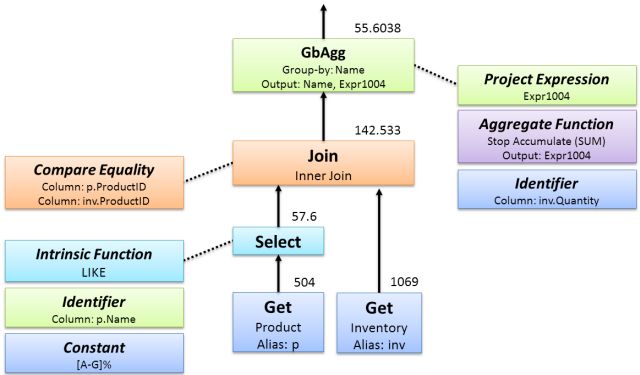
This structure is copied to the Memo, one group per logical node, as illustrated below:
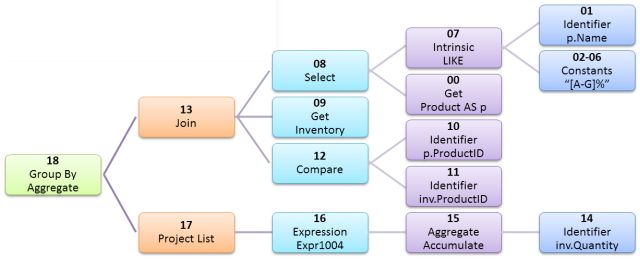
The group numbers and linked structure shown are obtained directly from the trace flag output:
--- Initial Memo Structure ---
Root Group 18: Card=57.6 (Max=10000, Min=0)
   0 LogOp_GbAgg 13 17
Group 17:
   0 AncOp_PrjList  16
Group 16:
   0 AncOp_PrjEl  15
Group 15:
   0 ScaOp_AggFunc  14
Group 14:
   0 ScaOp_Identifier
Group 13: Card=142.533 (Max=10000, Min=0)
   0 LogOp_Join 11 12 2
Group 12: Card=1069 (Max=10000, Min=0)
   0 LogOp_Get
Group 11: Card=57.6 (Max=10000, Min=0)
   0 LogOp_Select 10 9
Group 10: Card=504 (Max=10000, Min=0)
   0 LogOp_Get
Group 9:
   0 ScaOp_Intrinsic  3 4 5 6 7 8
Group 8:
   0 ScaOp_Const
Group 7:
   0 ScaOp_Const
Group 6:
   0 ScaOp_Const
Group 5:
   0 ScaOp_Const
Group 4:
   0 ScaOp_Const
Group 3:
   0 ScaOp_Identifier
Group 2:
   0 ScaOp_Comp  0 1
Group 1:
   0 ScaOp_Identifier
Group 0:
   0 ScaOp_Identifier
Each group has an entry number (all zero above since there is only one logical entry per group at this stage), with a logical operation (e.g. LogOp_Join), and the group numbers of any child groups (e.g. the logical join in group 13 references its two inputs, groups 8 and 9, and a logical comparison defined by the sub-tree starting at group 12).
Optimization Phases
One the initial Memo has been populated from the input tree, the optimizer runs up to four phases of search. There is a documented DMV, sys.dm_exec_query_optimizer_info, which contains a number of counters specific to query optimization.
Four of these counters are ‘trivial plan’, search 0’, ‘search 1’, and ‘search 2’. The value for each counter keeps track of the number of times a search phase was entered.
By recording the values before and after a specific optimization, we can see which phases were entered. The current counter values on one of my test SQL Server instances is shown below, as an example:
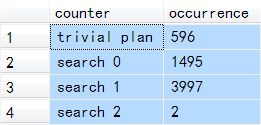
We look at each of the four phases in a bit more detail next:
Search 0: Transaction Processing
This phase is primarily concerned with finding good plans for OLTP-type queries, which usually join a number of tables using a navigational strategy (looking up a relatively small number of rows using an index).
This phase primarily considers nested-loops joins, though hash match may be used when a loops join implementation is not possible.
Many of the more advanced (and costly to explore) optimizer rules are not enabled during this search phase. SQL Server does not currently consider parallel plans in search 0, though like all other implementation details, this could change.
Search 1: Quick Plan (also known as Complex Query I)
This search phase can use most of the available rules, can perform limited join reordering, and may be run a second time (to consider parallel plans only) if the first run produces a plan with a high enough cost. Most queries find a final plan during one of the Search 1 runs.
Search 2: Full Optimization
This phase uses the most comprehensive search configuration, and may result in significant compilation times in some cases. The search is either for a serial or parallel plan, depending on which type was cheaper after search 1.
The scripts accompanying this series show another way to see which phases were run, using trace flag 8675. The output provides some extra insight into how things work (for example it shows the number of optimization moves (tasks) made in each stage). The only documented and supported way to see the search phases is via the DMV, however.
The 8675 output for our test query is:
End of simplification, time: 0 net: 0 total: 0 net: 0
end exploration, tasks: 174 no total cost time: 0.002 net: 0.002 total: 0 net: 0.003
end exploration, tasks: 175 no total cost time: 0 net: 0 total: 0 net: 0.003
end exploration, tasks: 513 no total cost time: 0.002 net: 0.002 total: 0 net: 0.005
end exploration, tasks: 514 no total cost time: 0 net: 0 total: 0 net: 0.005
end search(1),  cost: 0.0295655 tasks: 514 time: 0 net: 0 total: 0 net: 0.005
End of post optimization rewrite, time: 0 net: 0 total: 0 net: 0.006
End of query plan compilation, time: 0.002 net: 0.002 total: 0 net: 0.008
Entry and Termination Conditions
Each phase has entry conditions, a set of enabled rules, and termination conditions. Entry conditions mean that a phase may be skipped altogether; for example, search 0 requires at least three joined table references in the input tree.
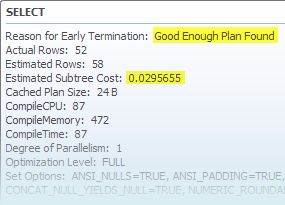
Termination conditions help to ensure the optimizer does not spend more time optimizing than it saves. If the current lowest plan cost boundary drops below a configured value, the search will terminate early with a Good Enough Plan Found result.
The optimizer also sets a budget at the start of a phase for the number of optimization ‘moves’ it considers sufficient to find a good plan (remember the optimizer’s goal is to find a good enough plan quickly). If the process of exploring and implementing alternatives exceeds this ‘budget’ during a phase, the phase terminates with a Time Out message.
Early termination (for whatever reason) is part of the optimizer’s design, completely normal, and not generally a cause for concern.
From time to time, we might wish that the optimizer had different goals —perhaps that we could ask it to continue searching for longer— but this is not how it works, by design.
It is all too easy to over-spend on optimization (finding transformations is not hard — finding ones that are robustly useful in a wide range of circumstances is), and full cost-based exploration is a memory and processor-intensive operation.
The optimizer contains many heuristics, checks and limits to avoid exploring unpromising alternatives, to prune the search space as it goes, and ultimately produce a pretty good plan pretty quickly, most of the time, on most hardware, in most databases.
Costing
First a quick summary: The optimizer runs up to four phases, each of which performs exploration using rules (finding new logical alternatives to some part of the tree), then a round of implementation rules (finding physical implementations for a logical part of the tree). New logical or physical alternatives are added to the Memo structure—either as an alternative within an existing group, or as a completely new group.
Note that the Memo allows the optimizer to consider very many alternatives at once in a compact and quick-to-search structure. The optimizer does not just work on one overall plan, performing incremental improvements (this is a common misconception). Each group is optimized separately, and the final plan is a stitched-together combination of the best group options.
Having found all these alternatives, the optimizer needs a way to choose between them. Costing runs after each round of implementation rules, producing a cost value for each physical alternative in each group in the Memo (only physical operations can be costed, naturally). Costing considers factors like cardinality, average row size, expected sequential and random I/O operations, processor time, buffer pool memory requirements, and the effect of parallel execution.
Like many areas of optimization, the costing calculations are based on a complex mathematical model. This model generally provides a good basis on which to compare alternatives internally, regardless of the workload or particular hardware configuration.
The costing numbers do not mean very much by themselves, so it is generally unwise to compare them between statements or across different queries. The numbers are perhaps best thought of as a unit-less quantity, useful only when comparing alternative plans for the same statement.
The model is just that of course: A model, albeit one that happens to produce very good results for most people most of the time. The slide deck that accompanies this series contains details of some of the simplifying assumptions made in the model.
Final Memo Contents
At the end of each search phase, the Memo may have expanded to include new logical and physical alternatives for each group, perhaps some completely new groups. We can see the contents after each phase using undocumented trace flag 8615:
-- Final memo
SELECT
    P.[Name],
    Total = SUM(INV.Quantity)
FROM
    Production.Product AS P,
    Production.ProductInventory AS INV
WHERE
    INV.ProductID = P.ProductID
    AND P.[Name] LIKE N'[A-G]%'
GROUP BY
    P.[Name]
OPTION
(
    RECOMPILE,
    QUERYTRACEON 8615
);
The final Memo (after each phase, remember) can be quite large, despite the techniques employed to constrain the search space. Our simple test query only requires a single run through search 1, and terminates early after 509 moves (tasks) with a Good Enough Plan Found message.
Despite that, the Memo contains 38 groups (up from 18) with many groups containing several alternatives. The extract below highlights just the groups that relate directly to the join implementation:
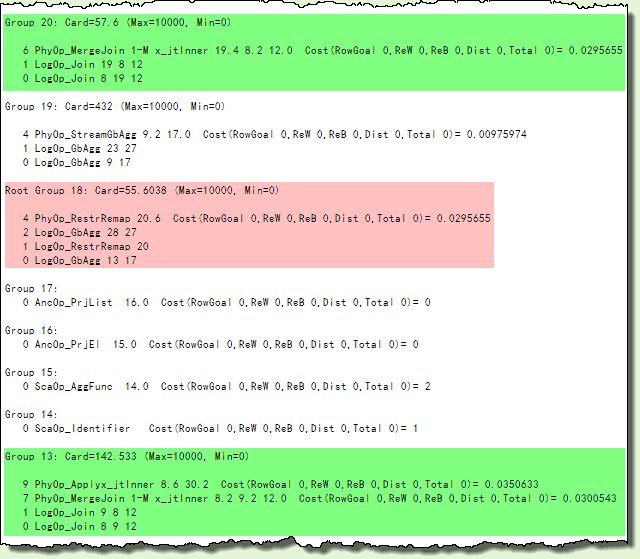
Looking at the green shaded areas, group 13 item 0 was the original (joining groups 8 and 9 and applying the condition described by the sub-tree starting with group 12).
It has gained a new logical alternative (via the JoinCommute rule, reversing the join input groups), and two surviving physical implementations:
- A one-to-many Merge Join as item 7, with group 8 option 2 as the first input, and group 9 option 2 as the second
- A physical inner Apply (correlated nested loops join) driven by group 8 option 6, on group 30 option 2.
Group 20 is completely new—another one-to-many Merge Join option, but this time with inputs from groups 19.4 and 8.2 with group 12 again as the join predicate.
The final selected plan consists of physical implementations chosen by starting with the lowest-cost physical option in the root group (18, shaded pink above).
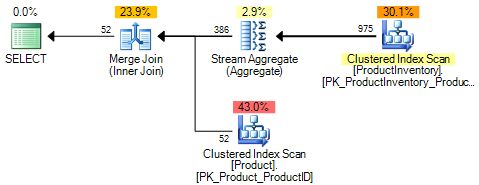
The sub-tree from that point has a total estimated cost of 0.0295655 (this is the same cost shown in the final graphical execution plan). The plan is produced by following the links in the Memo, from group 18 option 4, to group 20 option 6, and so on to the leaves.
The graphical form of the final execution plan is shown below:
