Can a SELECT query cause page splits?

Introduction
The SQL Server documentation has this to say about page splits:
When a new row is added to a full index page, the Database Engine moves approximately half the rows to a new page to make room for the new row. This reorganization is known as a page split. A page split makes room for new records, but can take time to perform and is a resource intensive operation. Also, it can cause fragmentation that causes increased I/O operations.
Given that, how can a SELECT statement be responsible for page splits?
Well, I suppose we could SELECT from a function that adds rows to a table variable as part of its internal implementation, but that would clearly be cheating, and no fun at all from a blogging point of view.
Tables and Sample Data
To demonstrate the effects I want to talk about today, I’m going to use a couple of tables with data copied from the sales data in the AdventureWorks sample database.
There’s a full script at the end of this post for those of you that like to run these things for yourselves, but the data generally looks like this: (header table on the left; detail table on the right):

Both tables have a clustered index on the SalesOrderID column.
Test query
The query I’m going to run is shown below, along with its execution plan:
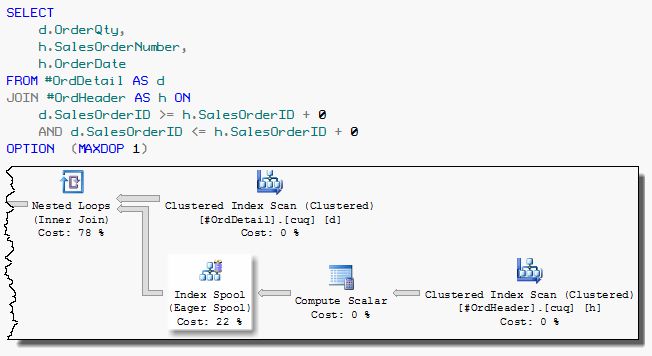
To prevent the optimizer choosing a hash or merge inner join plan (both of which require an equality predicate), I have expressed the join predicate as (X >= Y) AND (X <= Y) instead of the more natural (X = Y).
The + 0 in the join predicates is there to prevent the optimizer from using an indexed nested loop join (that is, using correlated seek on the inner side of the join).
These tricks are necessary to generate a plan with an Eager Index Spool on this small sample data set.
Checking for Splits
There are several ways to check for page splits while this query is running. I used the extended events UI that was new for SQL Server 2012.
Running the query above and looking for page splits via extended events, I get output like this:
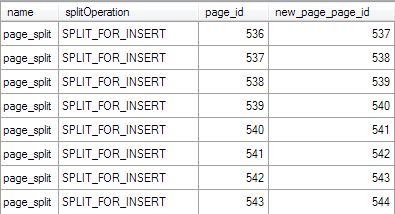
These page splits are all caused by the Eager Index Spool in the query plan. This iterator adds data rows to an internal worktable that has a temporary b-tree index.
Like any index insert operation, ‘page splits’ will naturally occur.
In fact this is a bit of a cheat, because these page splits aren’t the bad type of page splits at all. Notice the sequential nature of the pages being ‘split’ (the page_id column), and its relationship with the new page. This type of page split is benign— we’re just adding new pages to the end of the index.
Index Spool Internals
Having shown page splits that arguably aren’t really page splits, let’s get to demonstrating an index spool that ‘really does’ split pages, with all the expected overheads as described in the documentation extract at the top of this post.
To do that, we need to know something about the way index spools work. You have probably noticed that most query plans that build permanent indexes involve a Sort operator, which in turn requires a memory grant.
Index spools do not get a memory grant, and are not normally preceded by an explicit sort operator in query plans.
Given that indexes require sorting, how then does an index spool manage to ‘build’ a b-tree index structure at all?
The answer is that index spools just insert rows into an existing empty b-tree index. By default, the rows are inserted in the order they are received. In general, the rows will not be received in sorted order, resulting in lots of page splits in the temporary index b-tree.
The first run of the query did not suffer from this problem due to the clustered index on the header table, which tends to produce rows ordered by SalesOrderID—exactly the order of the spool’s index.
Bad page splits
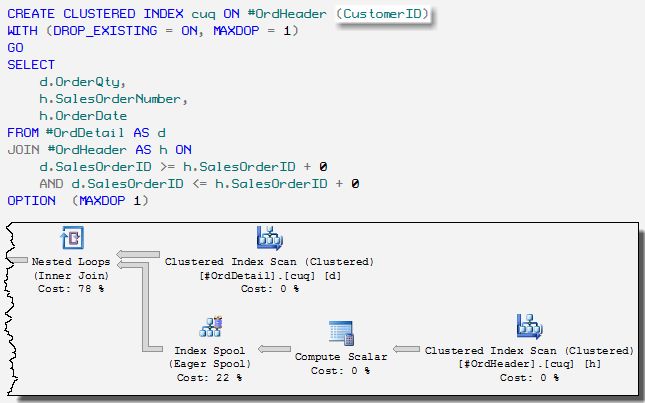
Let’s rebuild the header table clustered index to use the CustomerID column instead, and re-run the test.
The query plan looks exactly the same. The only difference is that the index spool is fed by a clustered index scan that is now extremely unlikely to produce rows in SalesOrderID order:
The page splits reported by the extended events ‘trace’ are now very different from before:
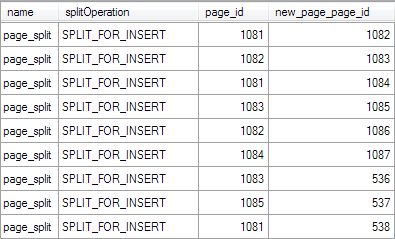
Notice that the same source page (page_id) is being split over and over again, as rows arrive in unsorted order.
As a consequence, there are now very many more page splits than before, and they are a lot more expensive. We are now not just allocating new empty pages at the end of the index—we have to shift half the rows, and fix up all the page pointers.
In practice, this is the sort of splitting you are likely to see in tempdb with an index spool. Rows are unlikely to be in index order already most of the time (else why would we need the spool at all?)
On that last point, consider the hoops I had to jump through to show a plan where the rows did happen to be presented in temporary index order—all that messing around with >= AND <= and + 0.
Side note: You can generally distinguish between mid-page splits and the end-of-index ‘splits’ using the technique Jonathan Kehayias shows here. That technique won’t work for our example because individual worktable inserts are not logged.
It is possible to introduce an explicit Sort to present rows in the order needed by the Index Spool using undocumented trace flag 9260, but this is not safe for production use. In case you are minded to take that warning lightly, please be assured this is a very lightly tested code path. I have seen retail assertions and stack dumps more than once through the use of this trace flag.
Parallel Index Spools
The last thing I want to cover about index spools is how they behave in parallel plans.
You might have noticed the MAXOP 1 hint in the previous examples. Let’s remove that now, add some wait type monitoring:
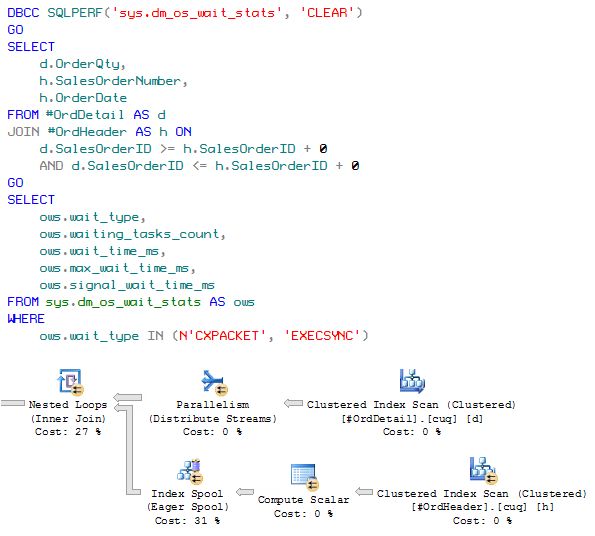
Don’t be fooled by the parallelism indicator on the index spool.
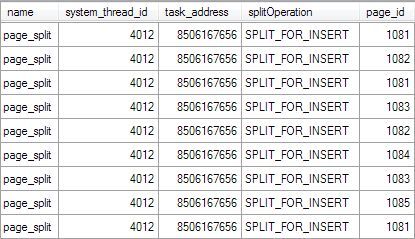
The temporary index insert part of the execution always happens on a single thread. Once the Eager Index Spool is fully populated, multiple threads can read from it concurrently.
One way to see this is to capture additional thread and task information in the page splitting event session used previously. The same task and thread ids are reported for every one of the hundreds of events:
The wait statistics provide additional confirmation:

Ignore the CXPACKET waits (they are perfectly normal) and look at the EXECSYNC waits.
This query ran at DOP 8 on my machine, so 7 parallel threads had to wait while a single thread inserted rows into the temporary index.
The index build took 114ms. Seven threads waiting simultaneously for that time gives 7 x 114 = 798ms. That’s within one quantum (4ms) of the total recorded EXECSYNC wait time (802ms).
EXECSYNC is used for lots of different things where synchronization of parallel workers needs to occur outside a Parallelism operator, so please don’t take away the idea that EXECSYNC necessarily always means an index spool was present or responsible.
Thanks for reading. The test script is below.
Test Script
-- Any AdventureWorks version should be fine
USE AdventureWorks2014;
GO
-- Tables
CREATE TABLE #OrdHeader
(
    SalesOrderID integer NOT NULL,
    OrderDate datetime NOT NULL,
    SalesOrderNumber nvarchar(25) NOT NULL,
    CustomerID integer NOT NULL
);
GO
CREATE TABLE #OrdDetail
(
    SalesOrderID integer NOT NULL,
    OrderQty smallint NOT NULL,
    LineTotal numeric(38,6) NOT NULL
);
GO
-- Data
INSERT #OrdHeader
SELECT
    H.SalesOrderID,
    H.OrderDate,
    H.SalesOrderNumber,
    H.CustomerID
FROM Sales.SalesOrderHeader AS H;
GO
INSERT #OrdDetail
SELECT
    D.SalesOrderID,
    D.OrderQty,
    D.LineTotal
FROM Sales.SalesOrderDetail AS D;
GO
-- Clustered indexes
CREATE UNIQUE CLUSTERED INDEX cuq
ON #OrdHeader (SalesOrderID)
WITH (MAXDOP = 1);

CREATE CLUSTERED INDEX cuq
ON #OrdDetail (SalesOrderID)
WITH (MAXDOP = 1);
GO
-- Test query
SELECT
    D.OrderQty,
    H.SalesOrderNumber,
    H.OrderDate
FROM #OrdDetail AS D
JOIN #OrdHeader AS H
    ON D.SalesOrderID >= H.SalesOrderID + 0
    AND D.SalesOrderID <= H.SalesOrderID + 0
OPTION
    (MAXDOP 1);
GO
-- Lose the friendly ordering
CREATE CLUSTERED INDEX cuq
ON #OrdHeader (CustomerID)
WITH
(
    DROP_EXISTING = ON,
    MAXDOP = 1
);
GO
SELECT
    D.OrderQty,
    H.SalesOrderNumber,
    H.OrderDate
FROM #OrdDetail AS D
JOIN #OrdHeader AS H
    ON D.SalesOrderID >= H.SalesOrderID + 0
    AND D.SalesOrderID <= H.SalesOrderID + 0
OPTION
    (MAXDOP 1);
GO
-- Parallelism
DBCC SQLPERF('sys.dm_os_wait_stats', 'CLEAR');
GO
SELECT
    D.OrderQty,
    H.SalesOrderNumber,
    H.OrderDate
FROM #OrdDetail AS D
JOIN #OrdHeader AS H
    ON D.SalesOrderID >= H.SalesOrderID + 0
    AND D.SalesOrderID <= H.SalesOrderID + 0;
GO
SELECT
    OWS.wait_type,
    OWS.waiting_tasks_count,
    OWS.wait_time_ms,
    OWS.max_wait_time_ms,
    OWS.signal_wait_time_ms
FROM sys.dm_os_wait_stats AS OWS
WHERE
    OWS.wait_type IN (N'CXPACKET', 'EXECSYNC');
GO
DROP TABLE
    #OrdHeader,
    #OrdDetail;
GO
/*
-- Extended Events Session Script (change the session_id filter!)
CREATE EVENT SESSION [Page Splits] ON SERVER
ADD EVENT sqlserver.page_split
    (
    ACTION(sqlos.system_thread_id,sqlos.task_address,sqlserver.sql_text)
WHERE
    ([package0].[equal_uint64]([sqlserver].[session_id],(60))))
ADD TARGET
    package0.ring_buffer(SET max_memory=(65536))
WITH
(
    MAX_MEMORY=4096 KB,
    EVENT_RETENTION_MODE=ALLOW_SINGLE_EVENT_LOSS,
    MAX_DISPATCH_LATENCY=30 SECONDS,
    MAX_EVENT_SIZE=0 KB,
    MEMORY_PARTITION_MODE=NONE,
    TRACK_CAUSALITY=OFF,
    STARTUP_STATE=OFF
);
*/