When is a Seek not a Seek?

Task
The following script creates a single-column clustered table containing the integers from 1 to 1,000 inclusive.
IF OBJECT_ID(N'tempdb..#Test', N'U') IS NOT NULL
BEGIN
    DROP TABLE #Test
END;
GO
CREATE TABLE #Test
(
    id integer PRIMARY KEY CLUSTERED
);
INSERT #Test
    (id)
SELECT
    V.number
FROM master.dbo.spt_values AS V
WHERE
    V.[type] = N'P'
    AND V.number BETWEEN 1 AND 1000;
Let’s say we are given the following task:
Find the rows with values from 100 to 170, excluding any values that divide exactly by 10.
Solution 1
One way to write that query would be to list each of the target values, omitting those that divide by 10:
SELECT
    T.id
FROM #Test AS T
WHERE
    T.id IN
    (
        101,102,103,104,105,106,107,108,109,
        111,112,113,114,115,116,117,118,119,
        121,122,123,124,125,126,127,128,129,
        131,132,133,134,135,136,137,138,139,
        141,142,143,144,145,146,147,148,149,
        151,152,153,154,155,156,157,158,159,
        161,162,163,164,165,166,167,168,169
    );
It produces a pretty efficient-looking query plan:

Solution 2
Knowing that the source column is defined as an integer, we could also express the query this way:
SELECT
    T.id
FROM #Test AS T
WHERE
    T.id >= 101
    AND T.id <= 169
    AND T.id % 10 > 0;
We get a similar-looking plan:

Cardinality estimation
If you look closely, you might notice that the line connecting the two icons is a little thinner than before.
The first query was estimated to produce 61.9167 rows – very close to the 63 rows we know the query will return.
The second query presents a tougher challenge to the cardinality estimator, because it doesn’t know how to predict the selectivity of the modulo expression (T.id % 10 > 0). Without that predicate, the second query estimates 68.1667 rows – a slight overestimate.
Adding the opaque modulo expression results in SQL Server guessing at the selectivity. The selectivity guess for a greater-than operation is 30%, so the final estimate is 30% of 68.1667, which comes to 20.45 rows.
Cost comparison
A second difference is that the Clustered Index Seek is costed at 99% of the estimated total for the statement. For some reason, the final SELECT operator is assigned a small cost of 0.0000484 units. This appears to have been fixed in more modern versions of SQL Server.
That quirk aside, we can still compare the total cost for both queries. The first one comes in at 0.0033501 units, and the second at 0.0034054.
The important point is that the second query is costed very slightly higher than the first, even though it is expected to produce fewer rows (20.45 versus 61.9167).
I/O comparison
The two queries produce exactly the same results, and both complete so quickly that it is tough to even measure CPU usage for a single execution.
We can compare the I/O statistics for a single run by running the queries with SET STATISTICS IO ON:
Table '#Test'. Scan count 63, logical reads 126, physical reads 0.

Table '#Test'. Scan count 1, logical reads 2, physical reads 0.
The query with the IN list uses 126 logical reads (and has a ‘scan count’ of 63), while the second query form completes with just 2 logical reads (and a ‘scan count’ of 1).
63 separate seeks
It is no coincidence that 126 = 63 * 2, by the way. It is almost as if the first query is doing 63 seeks, compared to one for the second query.
In fact, that is exactly what it is doing. There is no indication of this in the graphical plan, or the tool-tip that appears when you hover your mouse over the Clustered Index Seek icon.
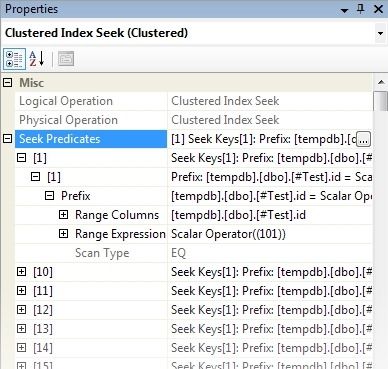
To see the 63 seek operations, you have click on the Seek icon and look in the Properties window (press F4, or right-click and choose from the menu):

The Seek Predicates list shows a total of 63 seek operations—one for each of the values from the IN list contained in the first query.
I have expanded the first seek node to show the details: It is seeking down the clustered index to find the entry with the value 101. Each of the other 62 nodes expands similarly, and the same information is contained (even more verbosely) in the XML form of the plan.
Each of the 63 seek operations starts at the root of the clustered index B-tree and navigates down to the leaf page that contains the desired key value.
Our table is just large enough to need a separate root page, so each seek incurs 2 logical reads (one for the root, and one for the leaf). We can see the index depth using the INDEXPROPERTY function, or by using a DMV:
SELECT
    S.index_type_desc,
    S.index_depth
FROM sys.dm_db_index_physical_stats
(
    DB_ID(N'tempdb'),
    OBJECT_ID(N'tempdb..#Test', N'U'),
    1,
    1,
    DEFAULT
) AS S;
Range query
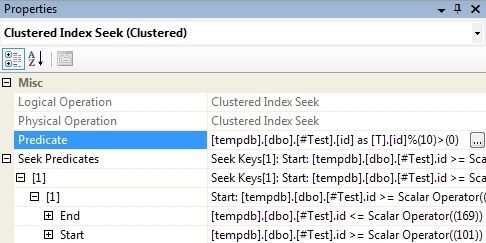
Let’s look now at the Properties window when the Clustered Index Seek from the second query is selected:

There is just one seek operation, which starts at the root of the index and navigates the B-tree looking for the first key that matches the Start range condition id >= 101.
It then continues to read records at the leaf level of the index (following links between leaf-level pages if necessary) until it finds a row that does not meet the End range condition id <= 169.
Every row that meets the seek range condition is also tested against the Residual Predicate highlighted above id % 10 > 0, and is only returned if it matches that as well.
Performance
The single seek (with range scan and residual predicate) is more efficient than 63 separate singleton seeks. It is not 63 times more efficient (as the logical reads comparison would suggest), but it is around three times faster.
Let’s run both query forms 10,000 times and measure the elapsed time:
DECLARE
    @i integer,
    @n integer = 10000,
    @s datetime = GETDATE();

SET NOCOUNT ON;
SET STATISTICS XML OFF; -- No execution plans

WHILE @n > 0
BEGIN
    SELECT
        @i = T.id
    FROM #Test AS T
    WHERE
        T.id IN
        (
            101,102,103,104,105,106,107,108,109,
            111,112,113,114,115,116,117,118,119,
            121,122,123,124,125,126,127,128,129,
            131,132,133,134,135,136,137,138,139,
            141,142,143,144,145,146,147,148,149,
            151,152,153,154,155,156,157,158,159,
            161,162,163,164,165,166,167,168,169
        );

    SET @n -= 1;
END;

PRINT DATEDIFF(MILLISECOND, @s, GETDATE());
GO
DECLARE
    @i integer,
    @n integer = 10000,
    @s datetime = GETDATE();

SET NOCOUNT ON;
SET STATISTICS XML OFF; -- No execution plans

WHILE @n > 0
BEGIN
    SELECT
        @i = T.id
    FROM #Test AS T
    WHERE
        T.id >= 101
        AND T.id <= 169
        AND T.id % 10 > 0;

    SET @n -= 1;
END;

PRINT DATEDIFF(MILLISECOND, @s, GETDATE());
On my laptop, running SQL Server 2008 build 4272 (SP2 CU2), the IN form of the query takes around 830ms and the range query about 240ms.
The main point of this post is not performance, however—it is meant as an introduction to the next few parts in this mini-series that will continue to explore scans and seeks in detail.
When is a seek not a seek? When it is 63 seeks!
Thanks for reading.
