Slow T-SQL Sums and Averages

It’s a curious thing about SQL that the SUM or AVG of no items (an empty set) is not zero, it’s NULL.
In this post, you’ll see how this means your SUM and AVG calculations might run at half speed, or worse. As usual though, this entry is not so much about the result, but the journey we take to get there.
Average of no rows
Take a look at this query written against the AdventureWorks sample database:

Notice the explicit NULL. The optimizer can see that this query contains a contradiction, 1=0, so there’s no need to access the table at all. The query will always compute an average over an empty set of rows, and the answer will always be NULL.
The Constant Scan operator constructs a row in memory without accessing any base tables, or needing to acquire any locks.
Normal sum and average calculations
Let’s look at a less trivial example:

Following the flow of data from right to left, the first thing to notice is that the optimizer has decided that the cheapest way to find all the ProductID values from the table is to scan the non-clustered index AK_Product_rowguid.
As the index name suggests, this is a nonclustered index on the row_guid column. Because ProductID is the unique clustered index for this table, the nonclustered index also includes the ProductID values at the leaf level of the index.
The nonclustered index is much narrower than the clustered index, because the latter contains all in-row table columns at the leaf level. In other words, all ProductID values in the table are stored much more densely in the nonclustered index. The higher density (and smaller size) of the nonclustered index means it is the lowest cost access method if all we need are product ids.
Calculation details
The output from the Index Scan operator is a stream of rows containing a single column – ProductID. The Stream Aggregate consumes all the rows from the Index Scan to compute two values:
- The number of rows encountered (
Count(*)) - The
SUMof the values (SUM(ProductID)).
The output from the Stream Aggregate is a single row with two columns:
- The result of the count is labelled
[Expr1011] - The result of the sum is labelled
[Expr1012]
The final step to compute the average of ProductID values is performed by the Compute Scalar. It computes a single expression ([Expr1003]) using a CASE statement, which first checks to see if the count of rows ([Expr1011]) is zero.
If the count is zero, the result is defined to be NULL, otherwise the average is computed as the SUM divided by the COUNT: [Expr1012] / [Expr1011].
Note that the left-to-right evaluation guarantee of the CASE statement ensures that a divide-by-zero error never occurs.
The plan for the same query using SUM instead of AVG is very similar:
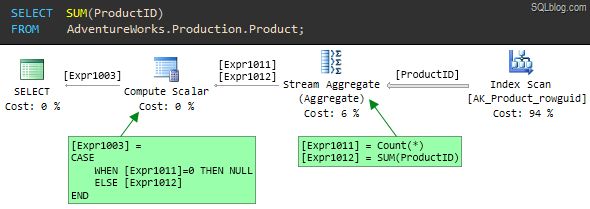
The only difference is in the Compute Scalar. The ELSE clause now returns the SUM if any rows were counted, rather than the average.
Counting rows
The interesting thing about both SUM and AVG examples is that the optimizer produces a plan which counts the rows as well as summing them. In both cases, the count is needed so the Compute Scalar can produce a NULL if no rows are aggregated.
One might think that it would be more efficient for the Stream Aggregate to just set a bit flag indicating whether zero or more rows were seen, rather than counting all of them, but that is not the way it works.
The question is, does this extra counting operation add any significant overhead to the query execution? The answer might surprise you — and it isn’t as simple as it seems.
Demo
To demonstrate the effect, we will need a larger table than the AdventureWorks database can provide.
USE master;
GO
IF DB_ID(N'SumTest') IS NOT NULL
BEGIN
    ALTER DATABASE SumTest
        SET SINGLE_USER
        WITH ROLLBACK IMMEDIATE;

    DROP DATABASE SumTest;
END;
GO
CREATE DATABASE SumTest
    COLLATE LATIN1_GENERAL_CS_AS;
GO
ALTER DATABASE SumTest
MODIFY FILE
(
    NAME = N'SumTest',
    SIZE = 1GB,
    MAXSIZE = 1GB
);
GO
ALTER DATABASE SumTest
MODIFY FILE
(
    NAME = N'SumTest_log',
    SIZE = 256MB,
    MAXSIZE = 256MB
);
GO
USE SumTest;
GO
ALTER DATABASE SumTest SET
    ALLOW_SNAPSHOT_ISOLATION OFF;

ALTER DATABASE SumTest SET
    AUTO_CLOSE OFF,
    AUTO_SHRINK OFF,
    AUTO_CREATE_STATISTICS ON,
    AUTO_UPDATE_STATISTICS ON,
    AUTO_UPDATE_STATISTICS_ASYNC OFF,
    PARAMETERIZATION SIMPLE,
    READ_COMMITTED_SNAPSHOT OFF,
    RECOVERY SIMPLE,
    RESTRICTED_USER;
GO
CREATE TABLE dbo.Test
(
    id bigint IDENTITY (1,1) NOT NULL,
    padding char(7999) NOT NULL,

    CONSTRAINT [PK dbo.Test (id)]
        PRIMARY KEY CLUSTERED (id),
);
GO
-- Minimally-logged in 2008 onward
INSERT dbo.Test
    WITH (TABLOCKX)
    (padding)
SELECT TOP (100000)
    padding = REPLICATE(CHAR(65 + ([Data].n % 26)), 7999)
FROM
(
    SELECT TOP (100000)
        n = ROW_NUMBER() OVER (
            ORDER BY (SELECT 0))
    FROM master.sys.columns AS C1
    CROSS JOIN master.sys.columns AS C2
    CROSS JOIN master.sys.columns AS C3
    ORDER BY
        n ASC
) AS [Data]
ORDER BY
    Data.n ASC;
That script creates a new database containing a single table with 100,000 very wide rows.
The id column is bigint IDENTITY, and the padding column is defined as char(7999). The data looks like this:
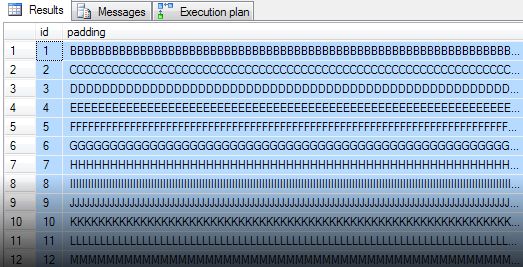
To make the test CPU-intensive, we’ll calculate CHECKSUM values for the REVERSE of the strings in the padding column, and SUM the result.
A natural way to write that query follows. The convert to bigint is to avoid an arithmetic overflow.

The plan is essentially the same as the ones seen previously, with the addition of an extra Compute Scalar to calculate the new processing-intensive expression.
This query runs for around 20 seconds, even with the table data entirely in memory.
If we run a similar query that uses a MIN or MAX aggregate instead of SUM, the query returns results in 10 seconds—half the time:
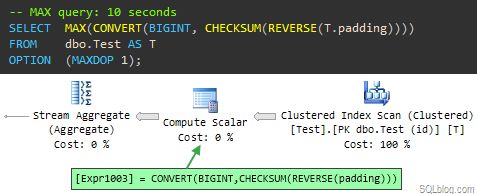
This is a very similar plan, but without the final Compute Scalar that decides whether to return NULL or not as seen in the SUM and AVG plans.
Explanation
Some people might compare the MAX and SUM queries and conclude that the difference in execution time is down to the missing Compute Scalar.
That would be wrong because the 10 seconds of extra CPU time cannot possibly be caused by a simple scalar computation operating on the single row present at that stage of the plan.
In fact, the problem is in the Stream Aggregate, which in the SUM plan is computing two expressions:
[Expr1009] = COUNT_BIG([Expr1003])
[Expr1010] = SUM([Expr1003])
[Expr1003] is our compute-intensive calculation, contained in the preceding Compute Scalar.
Compute Scalars
You would think that by the time the Stream Aggregate processes a row, the preceding Compute Scalar has already assigned a result value to [Expr1003] for that row, right?
Wrong! Compute Scalars are implemented a little differently from other plan operators. In general, a Compute Scalar operator does not perform the calculation as rows flow through it; the work is deferred until a later plan operator needs the computed value.
In most cases, this is a useful optimization because rows may be eliminated by a later join or filter before the result value is really needed. In this case, the Stream Aggregate is the first downstream operator to need the value of [Expr1003], and it references it twice: Once for the count, and once for the sum.
The shocking truth is that the plan evaluates the whole CHECKSUM(REVERSE(padding)) expression twice. One of those times it is just counting rows so it knows whether to return NULL later on or not.
The bug exposed, and a ‘workaround’
We can verify this is the case by writing the query a bit differently, to ensure that the expensive expression is calculated once before the Stream Aggregate receives the row:
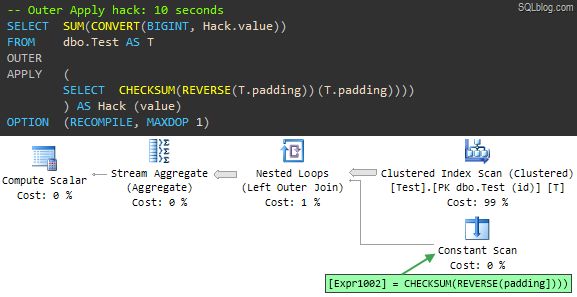
Now, the expensive expression is calculated in a Constant Scan operator rather than a Compute Scalar.
The Stream Aggregate still references the expression twice, once for the COUNT and once for the SUM, but it is counting and summing the result of the calculation, not causing the calculation to be performed twice.
This query form produces the same result as the 20-second query, but does so in only 10 seconds. Both tests push a single CPU to 100% utilization, in case you were wondering about that.
To really make the point, consider this query:
SELECT
    SUM(CONVERT(BIGINT, CHECKSUM(REVERSE(T.padding)))),
    SUM(CONVERT(BIGINT, 0 + CHECKSUM(REVERSE(T.padding))))
FROM dbo.Test AS T
OPTION
    (MAXDOP 1);
In the resulting plan, the Stream Aggregate references the CHECKSUM(REVERSE(padding)) expression four times, and the query runs for 40 seconds at 100% CPU!
You might also wonder why the rewrite uses an OUTER APPLY instead of CROSS APPLY. The reason is that with a CROSS APPLY, the optimizer sees through the trick and transforms the query plan to exactly the same form as before, and the query runs for 20 seconds as a result.
The OUTER APPLY is enough the defeat an optimizer transformation rule, resulting in a plan featuring a left outer join. Before you go off to rewrite all your SUMs and AVGs using OUTER APPLY, consider:
- The
OUTER APPLYtrick is a hack that depends on implementation details. It might not work tomorrow. - This problem only occurs if the first operator to need an expression result references it more than once.
- This bug is only noticeable if the expression is expensive.
This is a confirmed bug in SQL Server. The good news is that it has been fixed for SQL Server 2012. The bug was originally reported on Connect but that information was lost when Microsoft suddenly retired the site.
Indexed computed column
Finally for today, I want to show you another good reason not to use the OUTER APPLY pattern as a fix.
Let’s assume we don’t know about this problem, and need to optimize the original CHECKSM(REVERSE(padding)) query.
The obvious solution is to add a computed column, and index it:
-- Add computed column
ALTER TABLE dbo.Test
ADD [Expr1003]
AS CHECKSUM(REVERSE(padding));

-- Index it
CREATE INDEX
    [IX dbo.Test Expr1003]
ON dbo.Test
    ([Expr1003])
WITH
(
    FILLFACTOR = 100,
    MAXDOP = 1,
    SORT_IN_TEMPDB = ON
);
Note the new computed column is not persisted, so it doesn’t require any extra storage in the table itself, and does not fragment the clustered index.
Re-running the natural form of the query:

It now completes in 30ms—quite an improvement over 20,000ms.
The Stream Aggregate still performs the two SUM and COUNT operations, but now the expression result is available directly from the index. It isn’t calculated at all, let alone twice.
If we re-run the OUTER APPLY query, we find that it does not use the index and uses exactly the same plan as it did previously, again taking 10 seconds to run.
Ironically, it fails to take advantage of the index for the same reason it previously performed better: The rewrite trick prevents the optimizer from matching the computed expression to the index.
Attempting to force the use of the index results in a very unhappy plan:
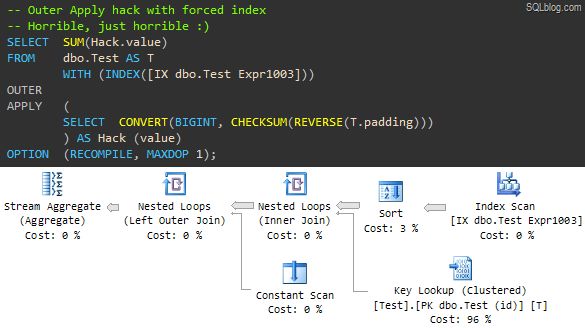
The optimizer still can’t make the transformation to use the pre-computed value from our index. It honours the hint in the only way it can, by using the index to retrieve id column values (the unique clustering key included in the non-clustered index).
It then performs a Key Lookup for every row into the clustered index to retrieve the padding column, and finally performs the expensive calculation once per row in the Constant Scan.
The Sort operator is there to ‘optimize’ the lookups. By pre-sorting on the clustering key (id) it hopes to turn the normally random I/O associated with a lookup into sequential I/O.
With the data all in memory, this plan still executes in ten seconds, but if the data needed to be fetched in from disk…well you try it.
So, how important is this bug? Well, it depends. You would have to take quite a deep look into each one of your production query plans to see how often a plan operator references a Compute Scalar expression more than once, where the expression is expensive to compute.
That’s probably not practical (though you could write some XQuery to search the plan cache for examples I suppose) but it is something to be aware of, just in case you come across a query that performs much slower than you might expect.
Anyway, the point of this post is once again that deep internals knowledge can sometimes come in very useful. Thanks for reading.
