The updated showplan schema shipped with SSMS 19 preview 2 contains an interesting comment:
ExclusiveProfileTimeActive: true if the actual elapsed time (ActualElapsedms attribute) and the actual CPU time (ActualCPUms attribute) represent the time interval spent exclusively within the relational iterator.
What does this mean?
Background
Batch mode plans report CPU and elapsed time spent within each individual operator.
Row mode plans report cumulative CPU and elapsed time for each operator including all its child operators.
This is confusing enough, but modern versions of SQL Server can produce execution plans with a mixture of batch mode and row mode operators in the same execution plan.
To interpret timings in these ‘mixed-mode’ plans, you need to know if each operator ran in batch mode (so timings are for that operator only) or row mode (where timings are cumulative).
This is a pretty horrible user experience.
Example
Using the StackOverflow2010 database, I’m going to reuse an example from Erik Darling’s post Considerations For Paging Queries In SQL Server With Batch Mode (Don’t Use OFFSET/FETCH):
DECLARE
    @page_number integer = 1,
    @page_size integer = 1000;

WITH Fetching AS
(
    SELECT
        P.Id,
        n = ROW_NUMBER() OVER (
            ORDER BY
                P.LastActivityDate,
                P.Id)
    FROM dbo.Posts AS P
)
SELECT
    P.*
FROM Fetching AS F
JOIN dbo.Posts AS P
    ON P.Id = F.Id
WHERE
    F.n > ((@page_number - 1) * @page_size)
    AND F.n < ((@page_number * @page_size) + 1)
ORDER BY
    P.LastActivityDate,
    P.Id
OPTION (RECOMPILE);
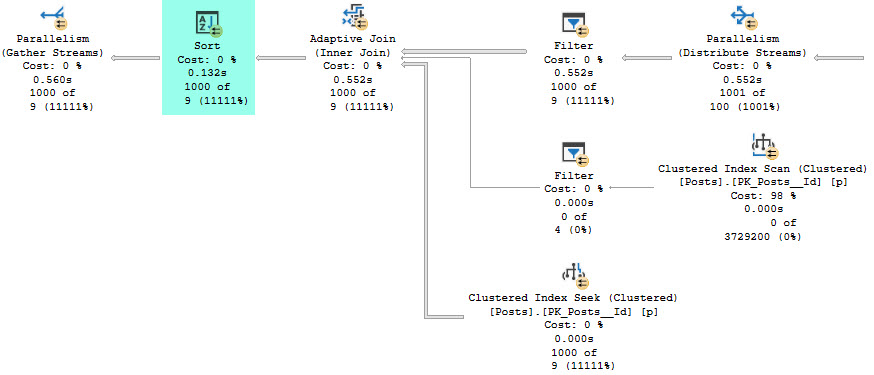
Running in SSMS 19 preview 2 on SQL Server 2022 RC0 the actual (post-execution) plan is (split in two parts):


The highlighted operators run in batch mode so the timings are for each operator alone. The remaining operators run in row mode with cumulative timings.
For example, the highlighted lone batch-mode Sort runs for 0.132s individually. Its immediate child, the Adaptive Join operator reports 0.552s elapsed time, which is cumulative.
The Improvement
The default behaviour in SQL Server 2022 RC0 is unchanged from previous versions, but as the note in the showplan schema suggests, there is a way to change things.
Previous changes to query profiling were gated by trace flags. For example, enabling the lightweight profiling infrastructure required documented trace flag 7412 with undocumented flag 7413 to disable, and undocumented flag 7415 to add I/O statistics.
This change is no different. It’s protected by global trace flag 7418 in SQL Server 2022 CTP 2.0 up to RC0. Being unannounced may mean the new feature is incomplete and/or untested. Or it may mean Microsoft simply haven’t decided whether to change the default behaviour yet.
That shouldn’t stop you from playing around with it on a disposable test instance, as all CTP installations should be:
DBCC TRACEON (7418, -1);
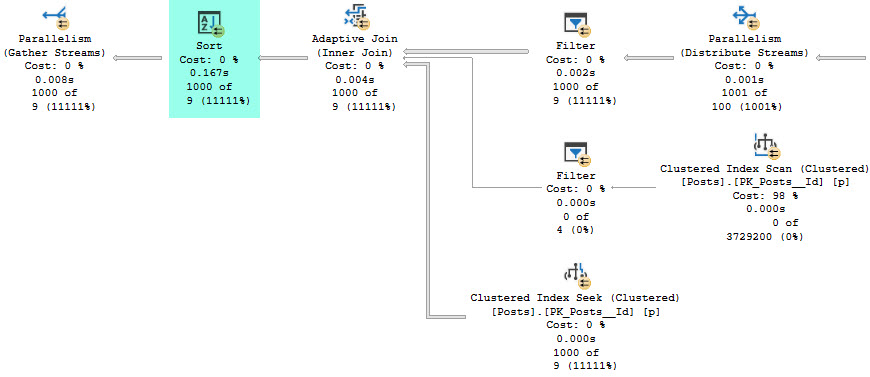
With that trace flag activated, the actual execution plan changes to:


The highlighted batch-mode operators have roughly the same timings as before. The row-mode operators have changed to match the behaviour of batch-mode.
All operators* now report individual times only.
For example, the row-mode Adaptive Join now shows 0.004s individual elapsed time instead of 0.552s cumulative.
*The one exception is the rightmost Gather Streams exchange. This is still attempting to estimate elapsed time using the dubious logic I explained at length in my article Understanding Execution Plan Operator Timings.
Caveats
For the moment, you should disregard exchange (Parallelism operators) elapsed times, especially those with a Thread 0 timing component (see the link just above for details). It seems likely Microsoft hasn’t completed the new behaviour for exchanges yet.
This improvement is an advance in consistency, but you should still treat elapsed times with caution. They are often an estimate and fundamentally prone to inaccuracy in parallel row-mode plans.
CPU timings are also available per-operator in execution plans, though you have to look in the Properties window for them and expand a couple of nodes.
I typically prefer CPU time over elapsed time as my primary performance metric. It’s a shame SSMS currently only prominently displays elapsed time. It would be nice to be able to flick between them.
Sorry but I missed the anonymous part and commented without my account.
ReplyDeleteReally good to check in a batch mode for individual operator times for those edge cases where they might struggle to get good execution times.