A few days ago I ran a Twitter poll:

The most popular answer gets highlighted by Twitter at the end of the poll, but as with many things on social media, that doesn’t mean it is correct:

It is a surprising answer, but as Mikael Eriksson noted, I wouldn’t have asked the question otherwise.
Now, I understand why some people might have chosen “any”. A parallel plan can indeed create (and use) many more threads than MAXDOP. That is not the focus of this post, so if you want more background on that, I will refer you to my previous article, Parallel Execution Plans – Branches and Threads.
Running Concurrently
The nuance to the question is in the phrase “running concurrently”. There is a limit to the number of characters one can use in a Twitter poll. My intention was for people to focus on the number of threads that could have a status of RUNNING at any one moment.
There are various definitions for that status in different DMVs, but essentially RUNNING means actively executing on a processor — not waiting for its turn on a CPU or for some other resource to become available.
My expectation was that most people would think that MAXDOP 4 would limit a parallel query to using 4 CPU cores at any one moment in time. Indeed, that was the second most popular answer to the poll.
The Extra Thread
This is often referred to as the Coordinator Thread, but I really dislike that term. It gives people the misleading impression that it is a new thread, only used to coordinate the activity of parallel worker threads in some way. Both these impressions are wrong.
When you run a T-SQL batch, you already have a thread. You wouldn’t be able to do anything otherwise, right? Your thread might parse the batch text, compile an execution plan for you (or retrieve one from cache), create automatic statistics, or one of very many things than can happen before a batch starts executing to return results or change the state of the database.
My point is you always start with one thread. That thread is not new, and isn’t “coordinating” anything. When you run a serial (non-parallel) query, that same thread runs the execution plan — all of it — to do whatever it is you want SQL Server to do.
Parallel Plan Execution
When you execute a parallel plan, that same original thread is all that exists at the beginning. SQL Server will have reserved extra parallel worker threads at that point, but none of them is attached to a task, and so has nothing to do.
The original thread (actually, let’s call it the parent thread) runs the whole of the parallel execution plan to the left of the leftmost Gather Streams operator.
A picture might be helpful at this point:

The parent thread (the one we always have) runs all the plan operators in the vaguely-purple region. It gets its work (rows) from the yellow-highlighted Gather Streams exchange.
The parent thread is also responsible for connecting up the first set of extra worker threads to tasks (things to do). It performs that work when it first reaches the leftmost Gather Streams exchange. Remember execution starts at the extreme left of the plan.
The parent thread creates tasks to run the vaguely-green portion of the plan, and connects each task to an extra worker thread from the reserved pool. The extra workers now have something to do, and can start executing the green-shaded operators beyond the Gather Streams.
This process repeats if further exchanges (Distribute Streams, Repartition Streams, and Gather Streams) are encountered further to the right of the plan. In this example, that happens at the yellow-shaded Repartition Streams exchange, at the border of the green and grey regions. A branch below a Distribute Streams runs serially, but this is still an extra worker thread – not the parent thread.
One of the green-region extra worker threads (the first one to arrive at the exchange) performs the work of creating tasks for the grey-shaded region. It attaches those new tasks to yet more extra worker threads from the pool of reserved threads. The grey region of the plan then starts executing, and so on until all branches are started.
Note that this second batch of work (creating tasks and attaching them to workers) is not performed by the parent thread. All extra worker threads do keep a reference to the parent so they can update shared execution statistics for the whole query, among other things.
MAXDOP and Worker Threads
MAXDOP limits the number of schedulers available to the pool of extra worker threads. At MAXDOP 4, how ever many extra threads are created and eventually attached to tasks, they will all be bound to one of 4 distinct schedulers. A scheduler is the SQLOS abstraction of a CPU core.
The coloured plan has 2 branches (we don’t count the parent thread’s branch). Four extra worker threads are reserved and bound to one of 4 schedulers in each of the green and grey regions.
Say we nominate schedulers with IDs {1, 3, 4, 7} for this MAXDOP 4 query. We have 2 branches, so 2 * 4 = 8 extra threads will be reserved. The threads might be bound as follows:
| Branch | Worker Thread ID | Scheduler ID |
|---|---|---|
| Green | 1 | 3 |
| Green | 2 | 7 |
| Green | 3 | 4 |
| Green | 4 | 1 |
| Grey | 5 | 4 |
| Grey | 6 | 7 |
| Grey | 7 | 1 |
| Grey | 8 | 3 |
This gives us 8 extra worker threads bound to four distinct schedulers. Each branch uses all 4 schedulers exactly once.
The Extra Scheduler
The foregoing is all in addition to the parent thread. The parent was bound to a scheduler when the batch started executing (and is likely the same scheduler each time a new batch is executed by that session).
The scheduler the parent thread uses is not limited to the set of of schedulers assigned to the extra workers.
There is an element of chance involved, but we might well end up with the following situation:
| Branch | Worker Thread ID | Scheduler ID |
|---|---|---|
| Purple | 0 | 5 |
| Green | 1 | 3 |
| Green | 2 | 7 |
| Green | 3 | 4 |
| Green | 4 | 1 |
| Grey | 5 | 4 |
| Grey | 6 | 7 |
| Grey | 7 | 1 |
| Grey | 8 | 3 |
Concurrently using 5 cores at MAXDOP 4
The purple parent thread runs its operators on scheduler 5, which is distinct from the group of 4 schedulers the extra workers are bound to. If the conditions are right, this query may execute on 5 schedulers at the same moment in time — one for the parent thread, and four for the extra workers.
For this to happen, there must be rows available at the Gather Streams for the purple parent thread to consume. If no rows are available, it will wait on CXCONSUMER. Similarly, the extra workers in the green region must be able to deposit rows at the same Gather Streams. If the internal buffers at the exchange are full, one or more of the extra workers will wait on CXPACKET.
If the green-region extra worker threads deposit rows at the Gather Streams at about the same rate they are consumed by the purple-region parent thread, all 5 schedulers can be actively executing at the same time.
If this situation persists for most of the execution time, the total CPU consumed may exceed the elapsed time by more than the MAXDOP factor. An example of this happening at DOP 2 is described in Forrest McDaniels post, MAXDOP is a Lie. He shows a query run at MAXDOP 2 that reports 124ms of CPU time and 42ms elapsed – a factor of 2.95.
Demo
The timing issues make this a little difficult to repro consistently on different hardware, so this is best-effort. The code is somewhat tweakable to allow you to see 5 concurrently-executing threads at MAXDOP 4 at least some of the time:
SELECT TOP (1)
    CHECKSUM_AGG(
        CONVERT(integer,
            HASHBYTES('SHA2_512',
                CONVERT(varchar(11),
                    CHECKSUM(*)))))
FROM master.dbo.spt_values AS SV1
CROSS APPLY
(
    SELECT DISTINCT SV2.number
    FROM master.dbo.spt_values AS SV2
    WHERE (SV1.number - SV2.number) % 15 = 0
) AS SV2
CROSS APPLY
(
    SELECT DISTINCT SV3.number
    FROM master.dbo.spt_values AS SV3
    WHERE (SV3.number - SV2.number) % 15 = 0
) AS SV3
OPTION (MAXDOP 4, NO_PERFORMANCE_SPOOL, FORCE ORDER);
The execution plan has 1 branch. The parent thread runs the serial Top and Stream Aggregate operators to the left of the Gather Streams. Extra worker threads run the remainder of the plan:
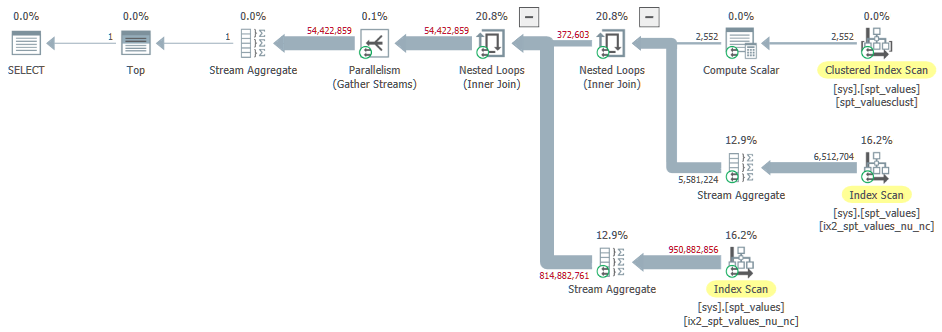
The thread reservation and usage is reported on the root node properties. Note this excludes the parent thread:

The query runs for about 3½ minutes on my 8-core i7 laptop, which gives us time to look at the DMVs:
-- Tasks and schedulers
SELECT
    DOT.task_address,
    DOT.task_state,
    DOT.scheduler_id,
    DOT.session_id,
    DOT.exec_context_id,
    DOT.request_id,
    DOT.parent_task_address
FROM sys.dm_os_tasks AS DOT
WHERE
    DOT.session_id = 66 -- Change this!
ORDER BY DOT.exec_context_id;
Typical results:

The parent thread has a NULL parent_task_address and is always exec_context_id 0. You can see five tasks all RUNNING at the same time with 5 distinct values of scheduler_id. The parent thread is running on scheduler 4, with the extra workers running on schedulers {6, 7, 1, 2}.
One might argue that the DMVs are not transactional, so we might be seeing overlapping states. To guard against that, I attached a debugger to SQL Server during query execution and confirmed that all five threads (parent and four workers) were running productive plan operator code simultaneously.
It is tough to get fully overlapping execution for the whole query lifetime because worker threads don’t get a completely equal distribution of work, so some threads finish before others. There may also be occasional and transient CXCONSUMER or CXPACKET waits during main execution. Still, typical execution time statistics for this query are:

This is a ratio of 4.22 so on average the query fully employed 4.22 cores at MAXDOP 4.
-- Waiting tasks
SELECT
    DOWT.exec_context_id,
    DOWT.wait_duration_ms,
    DOWT.wait_type,
    DOWT.blocking_task_address,
    DOWT.blocking_session_id,
    DOWT.blocking_exec_context_id,
    DOWT.resource_description
FROM sys.dm_os_waiting_tasks AS DOWT
WHERE DOWT.session_id = 66; -- Change this!
This DMV query will return empty results when the parent and extra workers are running at about the same rate. If the exchange runs out of rows for the parent, CXCONSUMER waits on the parent thread will appear. If the exchange buffers fill up because the parent is too slow, one or more extra workers will wait on CXPACKET.
You can adjust the modulo value in the query to adjust the rate at which workers deliver rows to the exchange if necessary. For CXCONSUMER waits, you would reduce the modulo so more rows qualify. For CXPACKET, increase the modulo to slow the row rate.
Make sure your DMV query doesn’t run on one the schedulers used by the test query. If that happens, you will always see one thread RUNNABLE because the test query is using the target scheduler at the time.
To monitor the number of distinct schedulers used by any parallel query, run:
-- All tasks
SELECT COUNT_BIG(DISTINCT DOT.scheduler_id)
FROM sys.dm_os_tasks AS DOT
WHERE DOT.session_id = 66; -- Change this!

-- Only extra workers (not the parent)
SELECT COUNT_BIG(DISTINCT DOT.scheduler_id)
FROM sys.dm_os_tasks AS DOT
WHERE DOT.session_id = 66 -- Change this!
AND DOT.parent_task_address IS NOT NULL;
Final Thoughts
Should this affect your choice of MAXDOP for a query or the instance as a whole? Maybe, but probably not.
There is a lot of guidance out there already for how to choose a starting point for MAXDOP and I am not particularly interested in entering that long-running and highly-charged debate to any great depth.
I will say that the behaviour described in the post is something to at least be aware of. Most parallel queries will likely have bigger issues, but you may encounter circumstances where the parent thread runs on a scheduler outside the MAXDOP group, and can do so effectively for much of the execution time. When that happens, you should probably regard it as a bonus that allows your query to run slightly quicker.
If you do find excessive parallelism despite tuning efforts, the phenomenon described here might help explain it. I would not routinely downgrade from say MAXDOP 8 to MAXDOP 7 just to allow the parent thread to potentially execute within the 8 cores in a single socket or NUMA node. SQL Server parallel thread placement is a bit hit-and-miss at the best of times, so attempting that sort of refinement might be a step beyond.
As always, test the alternatives. If it works better one way than the other, use that one 😀
Great post. I had a diabolical idea for a demo using this, and tried to put your code into a function. Stumbled across another SQL Server 2019 bug: https://feedback.azure.com/forums/908035-sql-server/suggestions/40843843-sql-server-2019-scalar-functions-fail-incorrectly (sigh)
ReplyDelete