Summary: A deep dive into SQL Server parallelism, and a potential performance problem with parallel plans that use TOP.
There was an interesting question asked by Mark Storey-Smith on Database Administrators Stack Exchange back in October 2011. Mark was looking at the execution plan for a query that counts a million rows from a table of numbers.
This is a slightly modified version of the query in the original question:
WITH
    N1 (n) AS
    (
        -- 10 rows
        SELECT 1 UNION ALL SELECT 1 UNION ALL SELECT 1 UNION ALL
        SELECT 1 UNION ALL SELECT 1 UNION ALL SELECT 1 UNION ALL
        SELECT 1 UNION ALL SELECT 1 UNION ALL SELECT 1 UNION ALL
        SELECT 1
    ),
    N2 AS (SELECT L.n FROM N1 AS L CROSS JOIN N1 AS R), -- 100 rows
    N3 AS (SELECT L.n FROM N2 AS L CROSS JOIN N2 AS R), -- 10,000 rows
    N4 AS (SELECT L.n FROM N3 AS L CROSS JOIN N3 AS R), -- 100,000,000 rows
    N5 AS (SELECT L.n FROM N4 AS L CROSS JOIN N1 AS R), -- 1,000,000,000 rows
    N6 AS
    (
        SELECT TOP (1000000) n
        FROM N5
    )
SELECT
    COUNT_BIG(*)
FROM N6
OPTION
(
    RECOMPILE,
    MAXDOP 1
);
This particular virtual numbers table is capable of producing up to a thousand million rows, via a number of cross joins, but the final common table expression N6 limits it to one million with the TOP clause.
The execution plan is just a sequence of cross joins of the ten in-memory rows defined by the first common table expression, N1:

The Constant Scan operator generates rows in memory without accessing a physical table.
These particular Constant Scans have an interesting property: The ‘virtual table’ contains ten rows, but no columns.
The query itself only counts rows — it does nothing at all with any column in those rows. The optimizer contains logic to only project columns that are actually needed later in the query plan.
If you look at the plan in SSMS or SQL Sentry Plan Explorer, you will see that the Constant Scans have a blank column Output List. In other words, they project no columns at all.
Execution Plans Suck
The plan above does illustrate an important concept in plan-reading: execution plans start executing at the left-most node. People are often told to read execution plans from the top-right, and that is fine if you just want to follow the flow of data — so long as you bear in mind that the flow of program control starts at the root (far left).
Rob Farley (blog | twitter) sums this up by saying:
Execution plans suck!
This is a reference to the fact that rows are pulled up the tree by parent operators requesting rows, one at a time, from the its child operator(s). Query execution follows a demand-based pipeline model. For more details, see my previous post Iterators, Query Plans, and Why They Run Backwards, and Brad Schulz’s entertaining overview, A Second in the Life of a Query Operator.
Our execution plan
Let’s look at the execution plan (with runtime statistics) changing the TOP specification from 1,000,000 to 100 to make it easier to see what’s going on:

I’m just showing part of the plan for clarity. There are another four Constant Scans off to the right that all produce one row.
If query plans really did start executing at the top right, we would expect 1 row from the right-most Constant Scan, 10 rows from its parent, and 100 at the next operator up the tree (working right to left).
In reality, the expected pattern (1, then 10, then 100) appears closest to the Top operator. This only makes sense if a row at a time is sucked up the plan from the root. The pipelined (row-by-row) model also explains why execution stops after 100 rows. The Top operator in the plan simply stops requesting a new row from its immediate child after it has seen the 100th row.
The Question
Back to the main point of today’s post. The DBA question arose when Mark ran his query with parallelism enabled:
WITH
    N1 (n) AS
    (
        -- 10 rows
        SELECT 1 UNION ALL SELECT 1 UNION ALL SELECT 1 UNION ALL
        SELECT 1 UNION ALL SELECT 1 UNION ALL SELECT 1 UNION ALL
        SELECT 1 UNION ALL SELECT 1 UNION ALL SELECT 1 UNION ALL
        SELECT 1
    ),
    N2 AS (SELECT L.n FROM N1 AS L CROSS JOIN N1 AS R), -- 100 rows
    N3 AS (SELECT L.n FROM N2 AS L CROSS JOIN N2 AS R), -- 10,000 rows
    N4 AS (SELECT L.n FROM N3 AS L CROSS JOIN N3 AS R), -- 100,000,000 rows
    N5 AS (SELECT L.n FROM N4 AS L CROSS JOIN N1 AS R), -- 1,000,000,000 rows
    N6 AS
    (
        SELECT TOP (1000000) n
        FROM N5
    )
SELECT
    COUNT_BIG(*)
FROM N6
OPTION
(
    RECOMPILE,
    MAXDOP 2
);
That produces an actual execution plan like this:

The question relates to the actual number of rows shown entering and leaving the Gather Streams exchange operator:

As would be expected, 1,000,000 rows leave the exchange operator, but the plan shows 1,004,588 rows entering it.
Are the row counts wrong? If not, where did the extra rows go?
The Answer
The answer lies in the fact that exchanges (Parallelism operators) contain buffers, as I explain in my article Understanding and Using Parallelism in SQL Server.
For efficiency reasons, rows are not passed across threads one by one as in the normal pipeline model. Instead, producer threads (on the right side of the exchange operator) pack rows one at a time into packets, and push completed packets across the exchange.
Consumer thread(s) on the left side of the exchange retrieve rows one at a time from the current packet on demand, re-establishing the demand-based pipeline model. The internal class name for the packets, by the way, is Class eXchange Packet, which gives us the familiar CXPACKET moniker.
Exploring the detail at little more, we can see from the execution plan that the two independent producer threads to the right of the exchange pack a total of 499,225 + 505,363 = 1,004,588 rows into packets, and the single consumer thread (thread zero) retrieves the 1,000,000 rows eventually requested by the Top operator:

The actual row counts shown in the execution plan are correct. The ‘missing rows’ are accounted for by rows that were added to packets but not ultimately needed by the consumer.
After the 1,000,000th row is passed by the Top to the Stream Aggregate (remember all these things happen one row at a time), the next time the Top gets control, it starts the process of shutting down the pipeline below it, rather than asking the Gather Streams exchange for another row.
Glossing over the finer details a little, instead of the Top calling a GetRow() method on the Gather Streams iterator, it calls a Close() method instead.
All versions SQL Server 2008 and later
On SQL Server 2005 that is the end of the story. Things just work as expected, with a small number of extra rows consumed by the buffering in exchange packets.
On SQL Server 2008 and later (including 2017), there is more. Let’s run the query one more time, but this time with a degree of parallelism of 3, rather than 2. Most of the time, we will get a plan that contains this sort of row count arrangement at the Gather Streams:

Much the same as before, a few thousand extra rows are processed by the producer threads than are ultimately needed by the consumer. That’s fine; the threads in a parallel plan execute independently, so there are bound to be small timing differences that lead to this sort of effect.
Every so often (perhaps 1 run in 10), executing this query will produce a result like this:

Whoa. Nearly 335 million rows entering the exchange – and the query now runs for 50 seconds or so, having run consistently for around 200ms previously.
Looking at the per-thread actual row counts is revealing:

If everything were perfectly balanced, we might expect each of the three producer threads to process around 333,000 rows. Indeed, thread 1 and thread 2 are in this ballpark area, but thread 3 worked its way through 334 million rows on its own!
I should mention that there is nothing special about thread 3 (you are as likely to find the huge row count on thread 1 or thread 2, the labels are arbitrary). Indeed, the problem can occur on any or all threads, as a second example run at DOP 3 shows below:


This time two threads went rogue, resulting in over 667 million rows being processed in a total execution time of 67 seconds.
Parallelism Problems?
There are other Parallelism (exchange) operators in the plan, though we have concentrated only on the final Gather Streams operator so far.
By the way, Gather Streams is also known as a Start Parallelism operator — a name that might surprise you since it seems to mark the end of parallelism in the plan, rather than the start. Remember that execution plans suck. The ‘final’ Gather Streams is in fact the first operator to start executing, and it is responsible for starting the parallel workers and attaching them to the threads that were reserved for this plan.
Anyway, I digress. Let’s look at the next exchange in the plan — reading left to right of course. This is a Repartition Streams exchange operating in Round Robin distribution mode:

This shows 1,000 rows arriving on the producer side of the exchange, and a total of 668 on the consumer side. Not shown in the diagram above, the producer side has 340 rows on thread 1, and 330 rows on each of thread 2 and thread 3.
Note that these are not the same threads as the ones we saw numbered the same way before. The numbering scheme is restarted for each independent parallel zone in the plan (zones are bounded by a Parallelism operator of one sort or another). Anyway, the point is that the rows are pretty evenly distributed on the producer side of the exchange.
On the consumer side (row counts illustrated above), things are rather different. Thread 1 (in this zone) processes 334 rows, thread 2 gets 333, and thread 3 gets only one. Now these are the same threads as shown in the 667 million row diagram.
I mentioned that parallel zones are bordered by Parallelism operators; the current zone is bordered by the Repartition Streams on its right side, and by the Gather Streams on its left. The same three threads are consumers at the Repartition Streams, and producers at the Gather Streams operator:

There is a clear relationship between the thread row counts at the consumer side of the Repartition Streams (334, 333, and 1 row) and the row counts at the producer side of the Gather Streams (334 million, 333 million, 338,614 rows).
The two problematic threads have multiplied their row counts by a factor of 1,000,000 — precisely the effect of the six cross joins in this parallelism zone. The Constant Scan virtual tables contain 10 rows each; multiplying by 10, 6 times over, gives the factor of 1,000,000.
Rogue Row Goals
Thread 3 in the example above ends up processing 338,614 rows. This number has no special significance, except it shows that this thread did not run this portion of the plan to completion. If it had, the single row it started with would have ended up as 1,000,000 rows by the time it had been cross-joined 6 times with the ten-row Constant Scan table.
This is the row goal in action (if you need a details on exactly what a row goal is, please see my post Inside the Optimizer: Row Goals In Depth).
Essentially, though, things like a TOP operator, a semi join, or a FAST n hint set a row goal. Plans normally run to completion, but row goals modify this, producing a plan that tries to optimize for a certain number of rows rather than the full potential set.
The TOP operator is even more special. As discussed briefly before, TOP can bring execution to an early end. Instead of continuing to ask for rows from its child iterator, it calls the Close() method instead.
This call propagates down the tree, and execution comes to an early end. (Strictly, row goals affect optimizer choices and plan costing rather than being associated with the early end of execution, but I like the phrase ‘rogue row goal’).
So, thread 3 did not run to completion. It responded to the early Close() call and only processed 338,000 of the 1,000,000 rows it could have produced if left alone.
Threads 1 and 2 never received the Close() call, or chose to ignore it. These two rogues went on to process their full potential row set — 667 million rows — despite the fact that the TOP had seen the million rows it needed, and was waiting for operations elsewhere in the parallel plan to stop. We can see this by looking at the sys.dm_os_waiting_tasks DMV while the long-running query is executing:
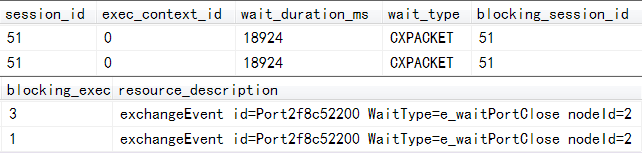
The output is split across two lines for readability, and shows execution context zero blocked on a CXPACKET wait by both execution context 1 and execution context 3.
Execution context zero is always thread zero — the so-called coordinator thread that runs the serial part of the execution plan to the left of the left-most Gather Streams operator. Put another way, context zero always runs the part of the plan before (reading left to right) the Start Parallelism operator (and therefore always runs a serial plan).
OK, so CXPACKET means the thread is involved in a parallelism-related wait. The extra detail in the resource_description column tells us that the wait is occurring at the node id 2. Checking the execution plan, we see that node 2 is indeed the Gather Streams exchange:

The wait type of e_waitPortClose means the consumer is waiting for the port to close. In more modern versions of SQL Server, the resource description adds a little extra detail (though the underlying issue is still exactly the same).
exchangeEvent id=Port259f7a9c300
    WaitType=e_waitPortClose
    waiterType=Coordinator
    nodeId=2 tid=0
    ownerActivity=opened
    waiterActivity=waitForAllOwnersToClose
If you are wondering what a port is in this context, I will just say the parallelism architecture is more complex than just CXPACKET — the internal wiring includes a CXPort class, a CXPipe class, a CXTransLocal (local transport) class and a CXTransRemote class (for the Parallel Data Warehouse edition). There is also a linked map structure that shows how the various pipes, ports, and transports connect together.
Closing the port is one step in shutting down part of a parallel plan which is running on the other side of an exchange (via a transport, pipe, and port). The stack trace below shows thread zero waiting for the port to close:

The important things are:
- This problem did not occur in SQL Server 2005
- A number of changes were made to the internal parallelism implementation in SQL Server 2008.
These changes seem to have introduced a bug (still present in SQL Server 2017 CU12), where the consumer can wait for the port to close, but one or more producers either ignore the request, or fail to check for it, and go on to process the whole potential result set instead of stopping early.
I was unable to reproduce the problem on SQL Server 2019 CTP 2.0 so perhaps it has finally been fixed. We will have to wait for RTM to be sure.
Not Just Nested Loops
Joe Chang suggested in the original comments that this problem might only occur with parallel nested loops joins. To address that, the script below reproduces the problem with parallel hash joins:
WITH
    N1 (n) AS
    (
        -- 10 rows
        SELECT 1 UNION ALL SELECT 1 UNION ALL SELECT 1 UNION ALL
        SELECT 1 UNION ALL SELECT 1 UNION ALL SELECT 1 UNION ALL
        SELECT 1 UNION ALL SELECT 1 UNION ALL SELECT 1 UNION ALL
        SELECT 1
    ),
    N2 AS (SELECT L.n FROM N1 AS L JOIN N1 AS R ON L.n % 1 = R.n % 1), -- 100 rows
    N3 AS (SELECT L.n FROM N2 AS L JOIN N2 AS R ON L.n % 1 = R.n % 1), -- 10,000 rows
    N4 AS (SELECT L.n FROM N3 AS L JOIN N3 AS R ON L.n % 1 = R.n % 1), -- 100,000,000 rows
    N5 AS (SELECT L.n FROM N4 AS L JOIN N1 AS R ON L.n % 1 = R.n % 1), -- 1,000,000,000 rows
    N6 AS
    (
        SELECT TOP (1000000) n
        FROM N5
    )
SELECT
    COUNT_BIG(*)
FROM N6
OPTION
(
    RECOMPILE,
    MAXDOP 4,
    QUERYTRACEON 8649
);
The full execution plan is rather large, but the key part is shown below:
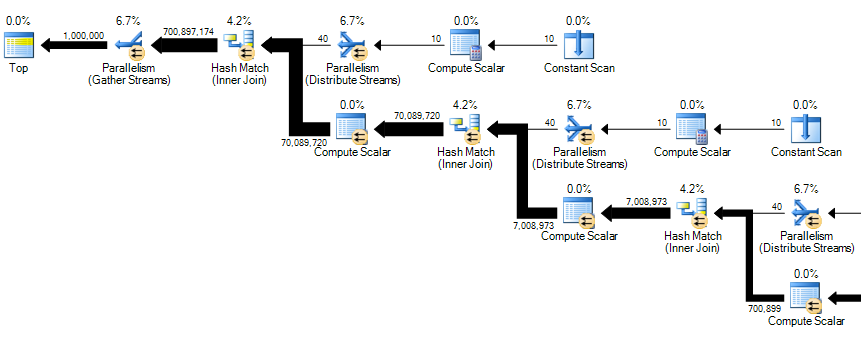
Yes, that is 700 million rows entering the Gather Streams exchange:

The bug does not occur in every query plan with a Top operator and parallelism, but the choice of nested loops join is not the cause. For clarity, the waiting tasks DMV shows the same sort of waits as the nested loops plan.
Final Thoughts
The potential for poor performance and excessive processor usage here is obvious. The chances of hitting the apparent race condition gets worse at higher DOP.
With eight threads per parallel zone (DOP 8), I hit this issue almost every time on SQL Server versions from 2008 to 2017 inclusive.
Because this behaviour does not occur on SQL Server 2005, but does on 2008 and later, I filed this as a bug on Connect (now retired, so that is an archive link). It was closed as Won’t Fix with the comment:
After carefully evaluating all of the bugs in our pipeline, we are closing bugs that we will not fix in the current or future versions of SQL Server. The reasons for closing this bug is because the scenarios reported in the bug are not common enough and so unfortunately it does not meet the bar for the current release.
Even so, as I mentioned before, this bug does appear to be fixed in SQL Server 2019 CTP 2.0 — I hope that remains the case for RTM. Perhaps it will even be back-ported.
Further Reading:
- Understanding and Using Parallelism in SQL Server
- Inside the Optimizer: Row Goals In Depth
- Iterators, Query Plans, and Why They Run Backwards
- A Second in the Life of a Query Operator by Brad Schulz
- The Parallelism Operator (aka Exchange) by Craig Freedman
© Paul White
email: SQLkiwi@gmail.com
twitter: @SQL_Kiwi
Thanks a lot Paul; Never knew we were the victims of this. Thanks again for sharing this in detail
ReplyDelete